






Silicon Metal Enters Explosive Growth Phase: Breakdown of Leading Players in Its Three Downstream Tracks
Since the launch of metallic silicon futures, all potential market participants have kept a close eye on its price movement. Polysilicon remained the primary source of incremental downstream demand for metallic silicon in 2023. Therefore, whether the disparity in capacity commissioning schedules between upstream metallic silicon and downstream polysilicon will trigger supply-demand mismatch, as well as the magnitude and duration of such imbalance, will be a core focus throughout 2023.
PART01
- Global Supply -
1.1 Global Production Pattern
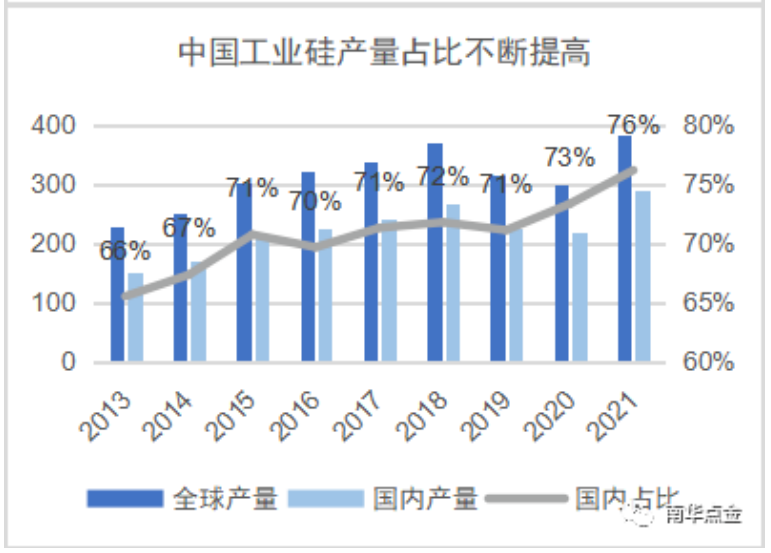
China is the world’s largest silicon metal producer with a steadily rising global output share in recent years. According to SMM data, global silicon metal capacity reached 6.32 million tons in 2021, including China’s 4.98 million tons, accounting for approximately 79% of the global total and securing China’s undisputed leading position worldwide. China’s silicon metal capacity went through rapid expansion and subsequent correction from 2013 to 2018, dominating overall changes in global capacity. Driven by lucrative profits, domestic capacity expanded continuously before 2018, while stricter approval rules for new capacity and tightened environmental policies after 2018 halted capacity growth and even led to moderate shrinkage via the phase-out of backward and non-compliant production capacity. Regulated by improving industrial policies, China’s silicon metal market has evolved from disorderly competition to orderly growth, with its global output proportion and industrial influence expanding year by year. SMM statistics show that after adjustments starting in 2018, global silicon metal output rebounded to 3.82 million tons in 2021, up 27% year on year; China’s output stood at 2.91 million tons, a year-on-year increase of 32% that accounted for 76% of the global total, leading the world in growth rate.
Source: SMM, Nanhua Research
By comparison, the silicon metal industry overseas started earlier with a high level of maturity, boasting stable production scale and high industrial concentration in recent years. Statistics from Antaike show that around 23% of global silicon metal capacity is located outside China, among which Brazil accounts for 5%, North America 4% and Norway 3%. Such overseas capacity is mainly controlled by major enterprises including Ferroglobe, Elkem and Dow, with the CR3 concentration ratio exceeding 50%. As overseas capacity remains relatively stable and there are barely any plans for large-scale new projects to be launched in the coming years, China will still be the main source of marginal supply growth for global silicon metal. Meanwhile, attention should be paid to overseas production suspension and output reduction risks triggered by power shortages (or excessively high power costs), labor strikes and other factors.
Source: Antaike, Nanhua Research
Major Overseas Silicon Metal Manufacturers
Source: SMM, corporate announcements, public information, Nanhua Research
1.2 Global Trade Flows
In terms of trade flows, major silicon metal producers including China, Brazil and Norway are also key exporters that continuously supply silicon metal to global downstream markets. SMM data shows China’s silicon metal output (covering 97-grade silicon and recycled silicon) accounted for 78% of the global total in 2021, followed by Brazil (7%), Norway (6%), the United States (3%) and France (3%). According to UN Comtrade statistics, the world recorded 1.644 million tons of silicon metal exports in 2021, 47% of which came from China, 14% from Norway and 12% from Brazil, with the remaining 27% supplied by other countries and regions. The exported silicon metal is mainly shipped to Europe, the United States, Japan, South Korea, India, Thailand and other destinations.
Source: UN Comtrade, Nanhua Research
Although China is the world’s largest exporter of silicon metal, its exports to Europe and the United States are blocked due to anti-dumping and countervailing duties, with most shipments diverted to Asia, resulting in fragmentation in global silicon metal trade. Starting from the late 1980s, Chinese silicon metal exports have faced anti-dumping investigations initiated by the EU. Over the past 30-odd years, the United States, Canada, Australia and other economies have successively ruled that Chinese silicon metal constitutes dumping and subsidization, imposing heavy punitive tariffs on relevant Chinese exports. As a result, China mainly ships silicon metal to Japan, South Korea, Southeast Asia and the Middle East, while the EU, the UK, the US and other markets source silicon metal primarily from Norway, Brazil and other suppliers. Against the backdrop of surging downstream photovoltaic installation demand in Europe and America, uncertainties remain on the policy front that will shape China’s silicon metal exports: whether Western anti-dumping and countervailing measures against China will be eased, and whether the US will leverage the so-called "Xinjiang issue" to rally its allies (especially Japan and South Korea) to further restrict silicon metal produced in Xinjiang.
Source: SMM, Nanhua Research
Restrictions Imposed by Europe, the US and Other Economies on Chinese Silicon Metal Import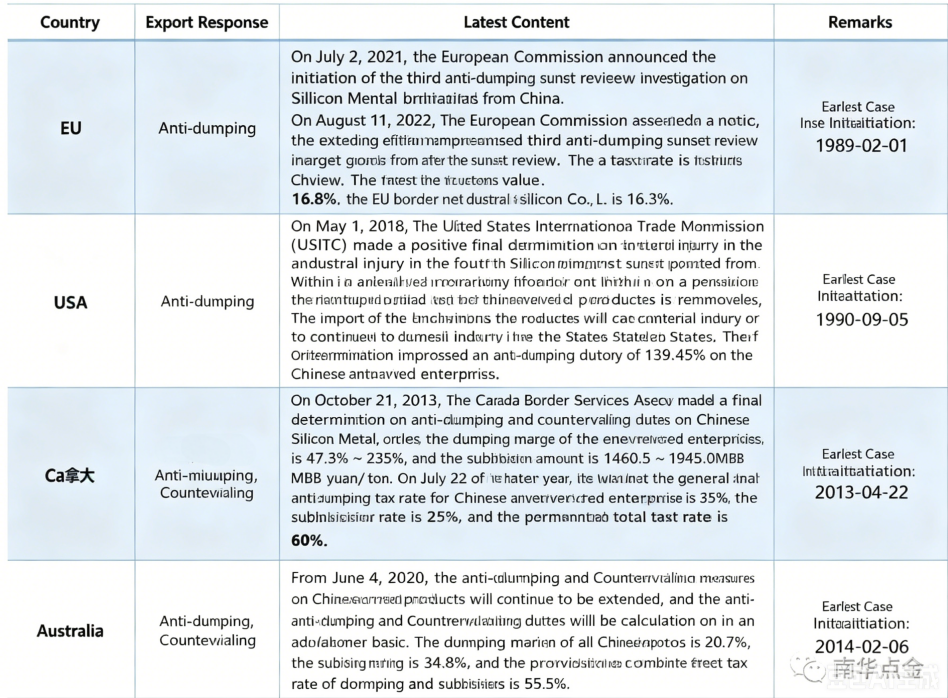 Source: Public data, Nanhua Research
PART02
Domestic Supply
2.1 Geographical Distribution of Domestic Capacity
Domestic silicon metal capacity presents distinct regional features, mainly concentrated in Xinjiang, Yunnan and Sichuan. According to SMM statistics, China’s total silicon metal capacity hit 4.986 million tons in 2021, including 1.685 million tons in Xinjiang (33.79%), 1.117 million tons in Yunnan (22.40%) and 0.817 million tons in Sichuan (16.38%). The two major production bases in Northwest and Southwest China together account for 73% of the national total capacity. The layout of silicon metal capacity is closely tied to raw material reserves and power costs. As stated in our special report Silicon Metal: Production Cost Analysis, silica stone suitable for mass silicon metal smelting is mainly found in Hubei, Sichuan, Gansu, Xinjiang, Yunnan, Inner Mongolia and other regions. Xinjiang enjoys prominent low electricity prices, while power tariffs in Sichuan and Yunnan stay relatively low nationwide during wet hydropower seasons.
Source: SMM, Nanhua Research
The supply of silicon metal in Sichuan and Yunnan shows obvious seasonal characteristics, while Xinjiang stands out with accelerated capacity expansion thanks to its resource and power advantages. As reflected in seasonal production charts, output in Sichuan and Yunnan remains high from May to October and slumps in the rest of the year. This gap mainly stems from the high reliance of local silicon metal production on hydropower, whose output varies drastically between wet and dry seasons. Data from Baiying Yingfu shows that hydropower accounted for 88.6% of power used for silicon metal production in Yunnan and 74.4% in Sichuan in October 2022. By contrast, hydropower is rarely adopted in Northwest China, with only 4% of Xinjiang’s silicon metal production powered by hydropower. As a result, the operating rate of silicon metal manufacturers in Sichuan and Yunnan drops to merely 20%-30% during dry seasons, yet rebounds to roughly 70% or above in wet seasons. In comparison, silicon metal production in Xinjiang runs more steadily without disruptions from uncertainties such as the pandemic. Moreover, Xinjiang boasts superior production cost advantages for silicon metal, making it the region with the largest domestic capacity growth in recent years. SMM statistics indicate that Xinjiang’s silicon metal capacity expanded by 613,000 tons from 2016 to 2021, enabling it to surpass Yunnan from an originally equal capacity scale to take a dominant national position.
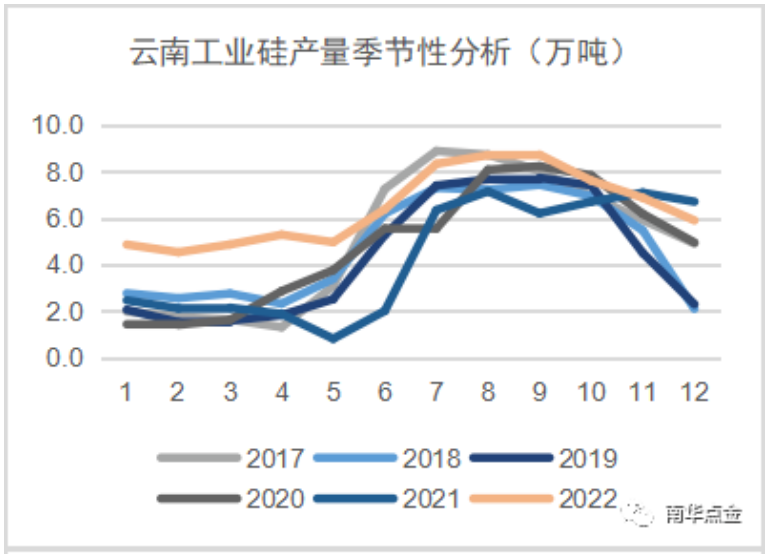
Source: SMM, Nanhua Research
2.2 Distribution of Domestic Silicon Metal Grades
There are various grades of silicon metal available domestically, yet only those meeting the national standard Si5530 and higher-quality grades are eligible for futures delivery. In terms of output proportion by grade, silicon metal of grade 553# and above accounted for over 70% of China’s total output in 2021, providing ample deliverable goods to satisfy the trading and delivery demands of most industrial participants in the silicon metal futures market. Grade 553# silicon metal is split into oxygen-blown and non-oxygen-blown variants; oxygen blowing serves to remove calcium impurities. Although non-oxygen-blown 553# theoretically meets delivery specifications, its actual pass rate is extremely low. SMM statistics show that the pass rate of non-oxygen-blown 553# stood at only around 30% in 2021, while oxygen-blown 553# and 421# (including 521# and 411#) recorded a pass rate of over 75%. In addition, deliverable standard grades feature distinct regional distribution patterns. Oxygen-blown 553# is predominantly produced in Xinjiang, whereas 421# (including 521# and 411#) is split almost equally among Xinjiang, Sichuan and Yunnan. Therefore, when the spot premium of 421# against futures exceeds 2,000 RMB per tonne (rendering delivery of 421# uneconomical), close attention must be paid to whether Xinjiang has sufficient deliverable silicon metal supply approaching delivery dates.
Source: SMM, Nanhua Research
2.3 Domestic Supply Concentration
In recent years, the supply of domestic silicon metal has shown a trend of rising industrial concentration. There are roughly more than 210 silicon metal manufacturers in China. However, according to Antaike’s 2021 Annual Market Analysis Report on Silicon Metal, the top 10 leading enterprises together accounted for about 50% of the national output, compared with merely 39% in 2016. Among them, Hoshine Silicon Industry held a dominant position, contributing over 30% of domestic silicon metal output in 2021. Its output share within the top 10 manufacturers also jumped from 43% in 2016 to 61% in 2021. The trend of market concentration toward leading enterprises has intensified both nationwide and among the top players.
Production Performance of China’s Top 10 Silicon Metal Manufacturers in 2021
Source: Antaike 2021 Annual Market Analysis Report on Silicon Metal, Nanhua Research
As the leading domestic silicon metal enterprise, Hoshine Silicon Industry’s capacity planning and industrial chain layout attract extensive market attention. Its future silicon metal capacity expansion is mainly located in Zhaotong, Yunnan Province. Nevertheless, hydropower resource constraints bring great uncertainties regarding the timeline and scale of capacity commissioning. Based on Hoshine’s current plans, the group will first satisfy all internal downstream demand with self-produced silicon metal before selling products externally. At present, the company’s theoretical external supply volume stands at 440,000 tons, which is expected to rise to 710,000 tons in the future.
Overview of Hoshine Silicon’s Silicon Metal Industrial Chain
Source: Corporate Annual Reports, Nanhua Research
2.4 Domestic Output Forecast
Against the backdrop of more rational policy guidance, silicon metal has been reclassified from a high energy-consuming industry to a high energy-carrying industry. Boosted by rising downstream demand, the silicon metal sector has entered another growth cycle, with roughly 1.5 million tons per annum of new capacity slated to come online in 2023. Geographically, most new capacity will be located in Northwest China, while in terms of timeline, most projects are scheduled to launch in the second half of the year. The commissioning pace of these new capacities will determine the severity and duration of supply-demand mismatch between upstream silicon metal supply and downstream polysilicon demand in H1 2023. We will elaborate on specific downstream polysilicon demand in our subsequent special report on demand analysis.
Domestic Output Forecast for 2023